
Predicting Law School Admissions Outcomes
Can law school admissions outcomes be predicted by an applicant’s profile?

Oh Elle, it is indeed hard. In Legally Blonde, Elle follows her ex-boyfriend to Harvard Law by having a 4.0 GPA, getting a near-perfect LSAT score, and appealing to the admissions committee’s desire for a well-rounded class (they don’t get many fashion majors). For once, Hollywood isn’t too far off.
Admissions committees consider the applicant’s profile to create a diverse class, but LSAT scores and GPAs carry the heaviest weight. This means law school admissions are actually fairly formulaic, making this a promising candidate for a machine learning project. In this project, I investigate: can law school admissions outcomes be predicted by an applicant’s profile?
Check out my code for this project here.
How do you predict admissions results?
I used several machine learning models which use statistics to “learn” about data and make predictions. In this case, these models “learned” or were trained with law school admissions data to be able to predict whether an applicant was admitted to or rejected from a school. This process involves: 1) Exploratory data analysis to see the available data and look at its distribution 2) Feature engineering to create features (data inputs) to be used in the machine learning models 3) Feature selection to decide which features will be used in the models 4) Evaluating models for accuracy in predicting the target (law school admissions outcomes) 5) Fine-tuning models to increase accuracy
The dataset used in the project was downloaded from MyLSN which compiles the data from Law School Numbers (LSN). This data is all self-reported by applicants and includes over 400,000 applications from 42,000 applicants. While this wealth of data is exciting, it also carries some caveats. Because this data is self-reported, it may not be accurate and it is not representative of the full pool of applicants.
How does the data look?
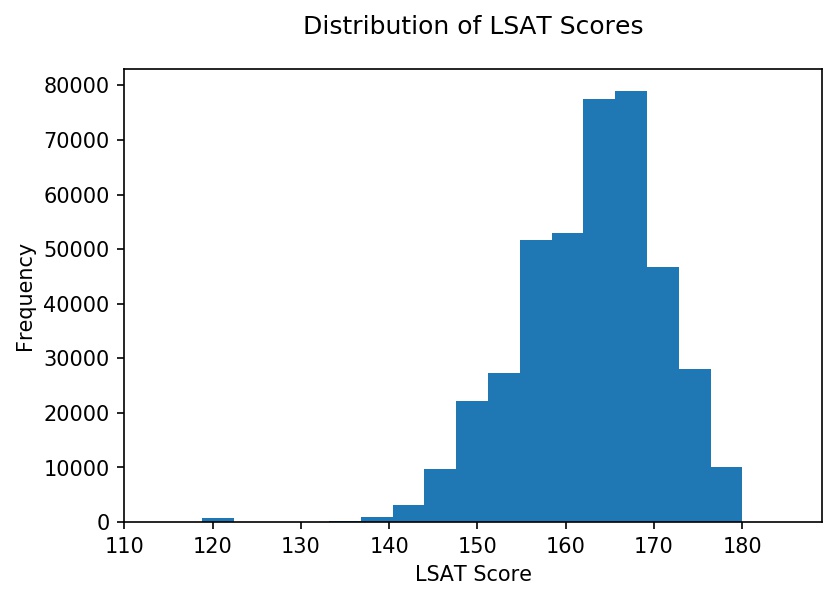
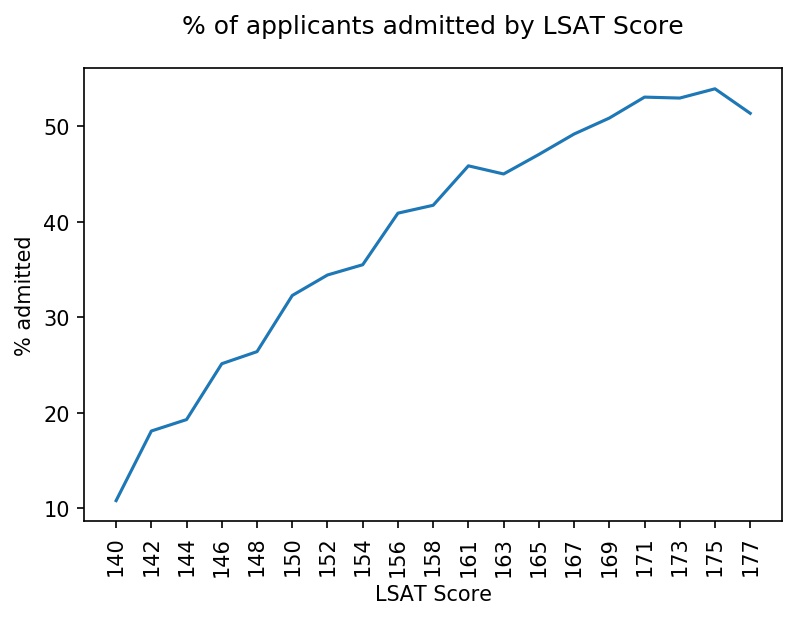
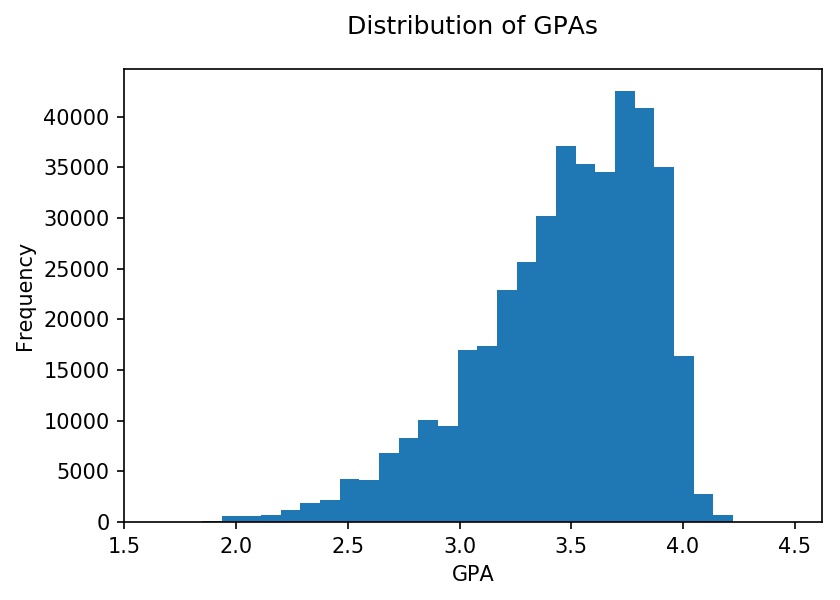
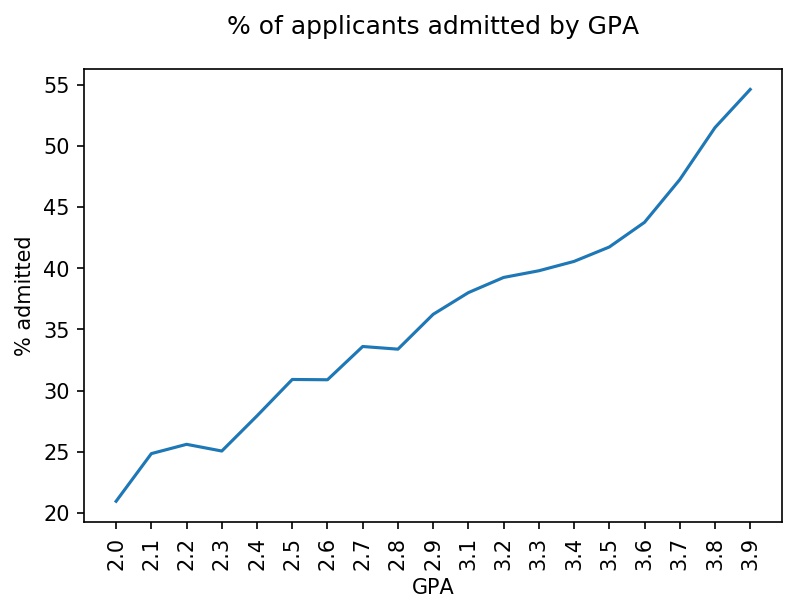
To get familiar with the dataset, I performed an exploratory data analysis. See below for the distribution of LSAT scores and the percentage of applicants admitted by LSAT score. The latter is in line with expectations, with higher LSAT scores correlating with higher admission rates. Similarly, higher GPAs are correlated with higher admission rates.
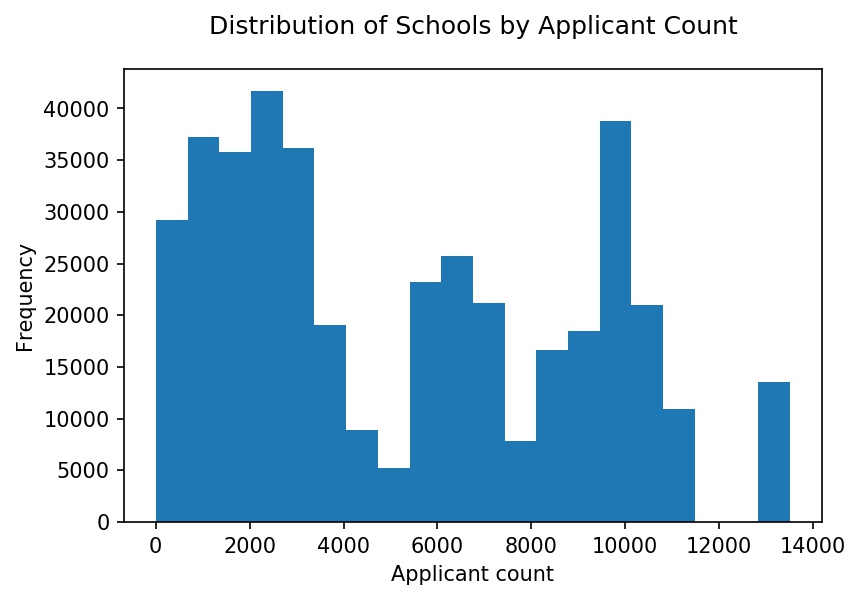
Applicants applied to 215 law schools. Below is a histogram with the distribution of applications at each school. The distribution is roughly trimodal with a group of schools that received over 8,000 applications, schools that received 4,000 - 8,000 applications, and schools that received fewer than 4,000 applications.
Which features (data inputs) will be used to predict admissions outcomes?
Features are the data inputs that will be used in the machine learning models. More data generally improves the accuracy of a model, but this data should be of high quality. An important consideration in quality is null (missing) values. Features with too many null values were excluded from the model.
The features selected for the model were: LSAT score, GPA, law school, and race. In addition to these, additional features were created in a process called feature engineering. These features are based on contextual knowledge and may improve model performance. In this case, the features are:
- A combined LSAT-GPA score: captures academic performance in one figure with LSAT scores and GPAs evenly weighted
- In state: indicates if the applicant is applying to a school that is in-state
- Applicant count level: indicates if the school receives a lot of applications, according to this data set
Which model predicts admissions outcomes with the highest accuracy?
Accuracy was measured in terms of mean absolute error (MAE), which is the average of the difference between the predicted target and actual target. Five machine learning models from scikit-learn were trained with our data:
- Decision tree: This model recursively splits the data set into homogenous sets. This resembles a tree where each node contains criteria (e.g., LSAT score) that splits the tree into branches. Each branch terminates at a leaf with the prediction target (e.g., admissions outcome).
- Random forest: This model is a collection of decision trees which combines their outputs to improve the accuracy of its predictions.
- Logistic regression: This model predicts the probability of a target by fitting data to a logistic function.
- KNN (k-Nearest Neighbors): This model stores all data points and makes predictions based on similarity to existing data points.
- Naive Bayes: This model assumes all features are independent to calculate the probability of an outcome.
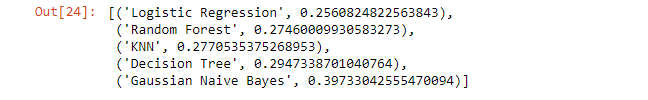
These models were trained with our dataset and their MAEs are listed below. The logistic regression and random forest models were the most accurate, with an MAE of 0.256 and 0.275 respectively.
Can the accuracy of our model be improved?
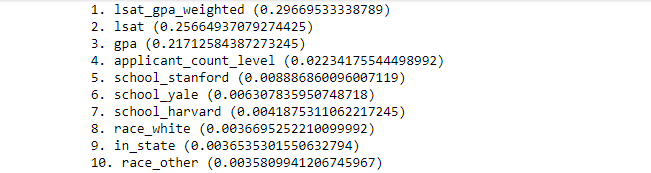
Models can be improved by iteratively adjusting features and model parameters. To sanity check the features, feature importance was calculated for the random forest model (see below). Larger numbers correlate with greater importance and, as expected, GPA and LSAT were the most important features. They were followed by applicant_count_level and the three most competitive law schools: Stanford, Yale, and Harvard.
For the random forest model, model parameters can be optimized as a balance between resources (time, processing power) and accuracy. The two parameters that were optimized were n_estimators (the number of decision trees) and max_features (the number of features considered when splitting).
The models were run for a list of values for each parameter and an optimized value was selected for each. In this case, n_estimators was optimized at 100 and max_features at 50. These optimized parameters were used together in the random forest model which had a MAE of 0.26, which represents 74% accuracy. This represents a 1.5 percentage point improvement in accuracy just from tweaking model parameters. While this figure is small, future iterations of this project could improve accuracy through ensemble methods, which combine machine learning models.